NFL Injury Analysis (2012-2015)
1 Introduction
This report presents an analysis of NFL injury data from the 2012 to 2015 seasons, focusing on concussion injuries, their impact on players and teams, and trends observed over this period.
2 Key Findings
2.1 Concussion Trends

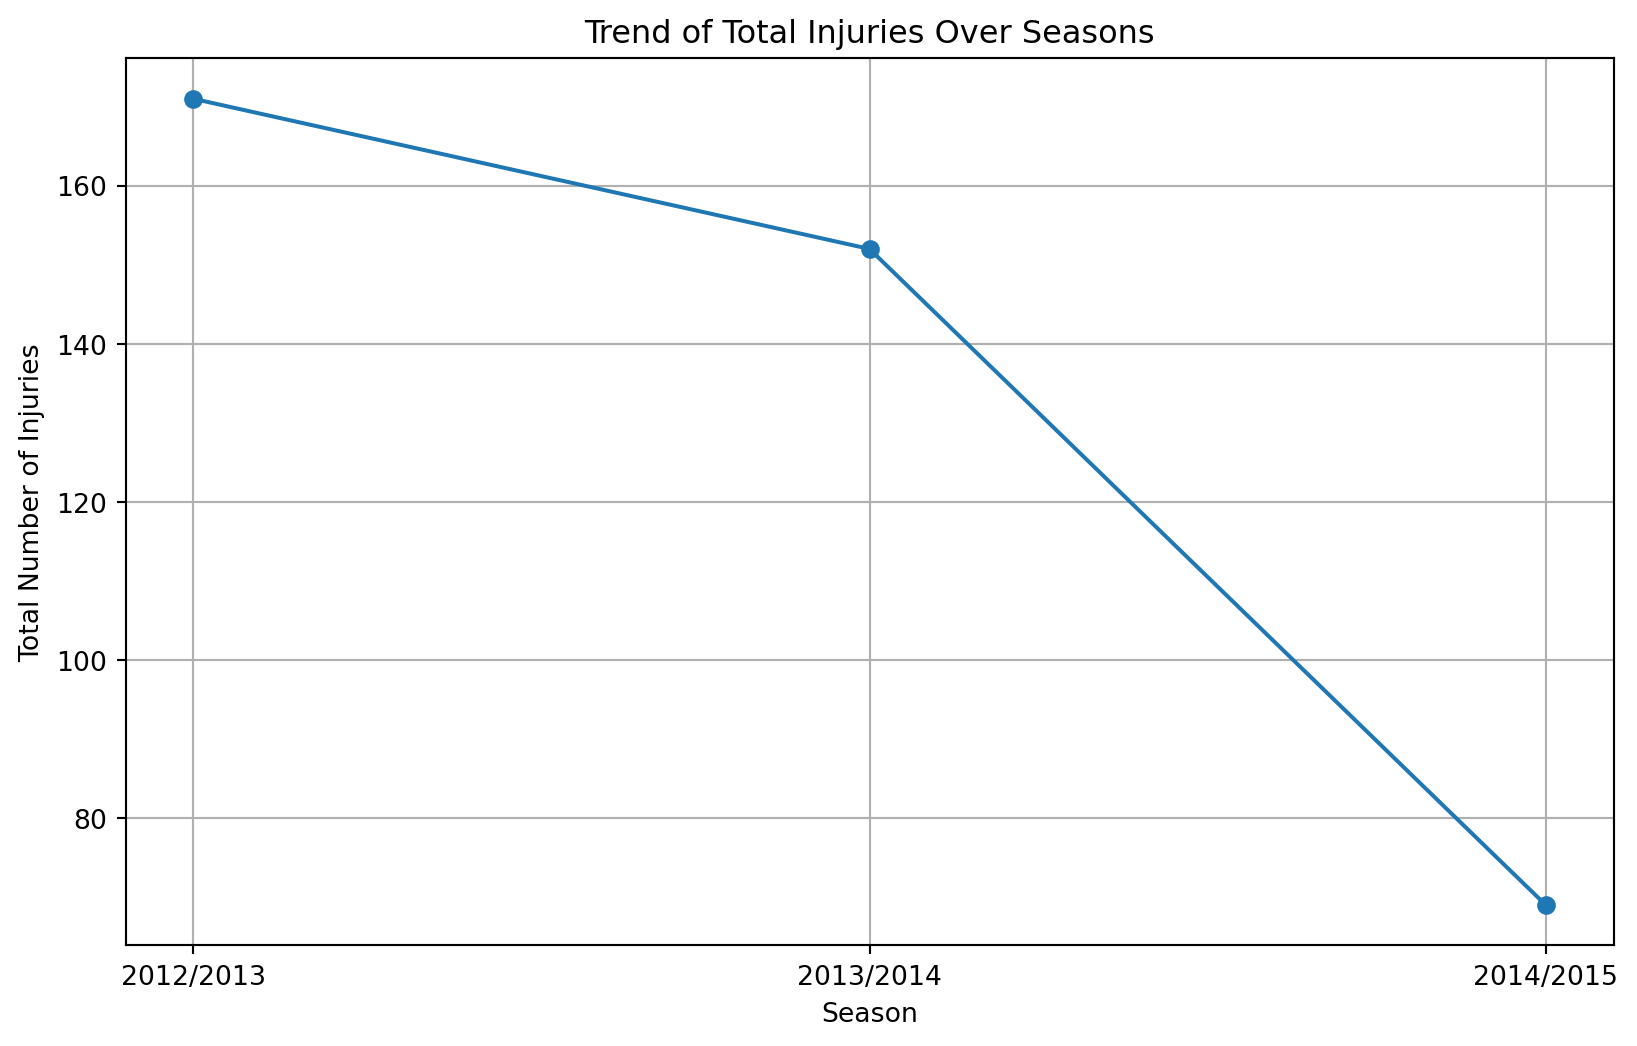
The graph above shows the trend of total injuries over the seasons from 2012 to 2015. [Interpret the trend here based on the graph]
2.2 Player Impact
- The average number of games missed due to concussions is 0.93.
- Players with the most frequent injuries:
- Alex Smith (3 injuries)
- Vontaze Burfict (3 injuries)
- Joe Reitz (3 injuries)
- Dan Connolly (3 injuries)
- Craig Stevens (3 injuries)
2.3 Team Analysis
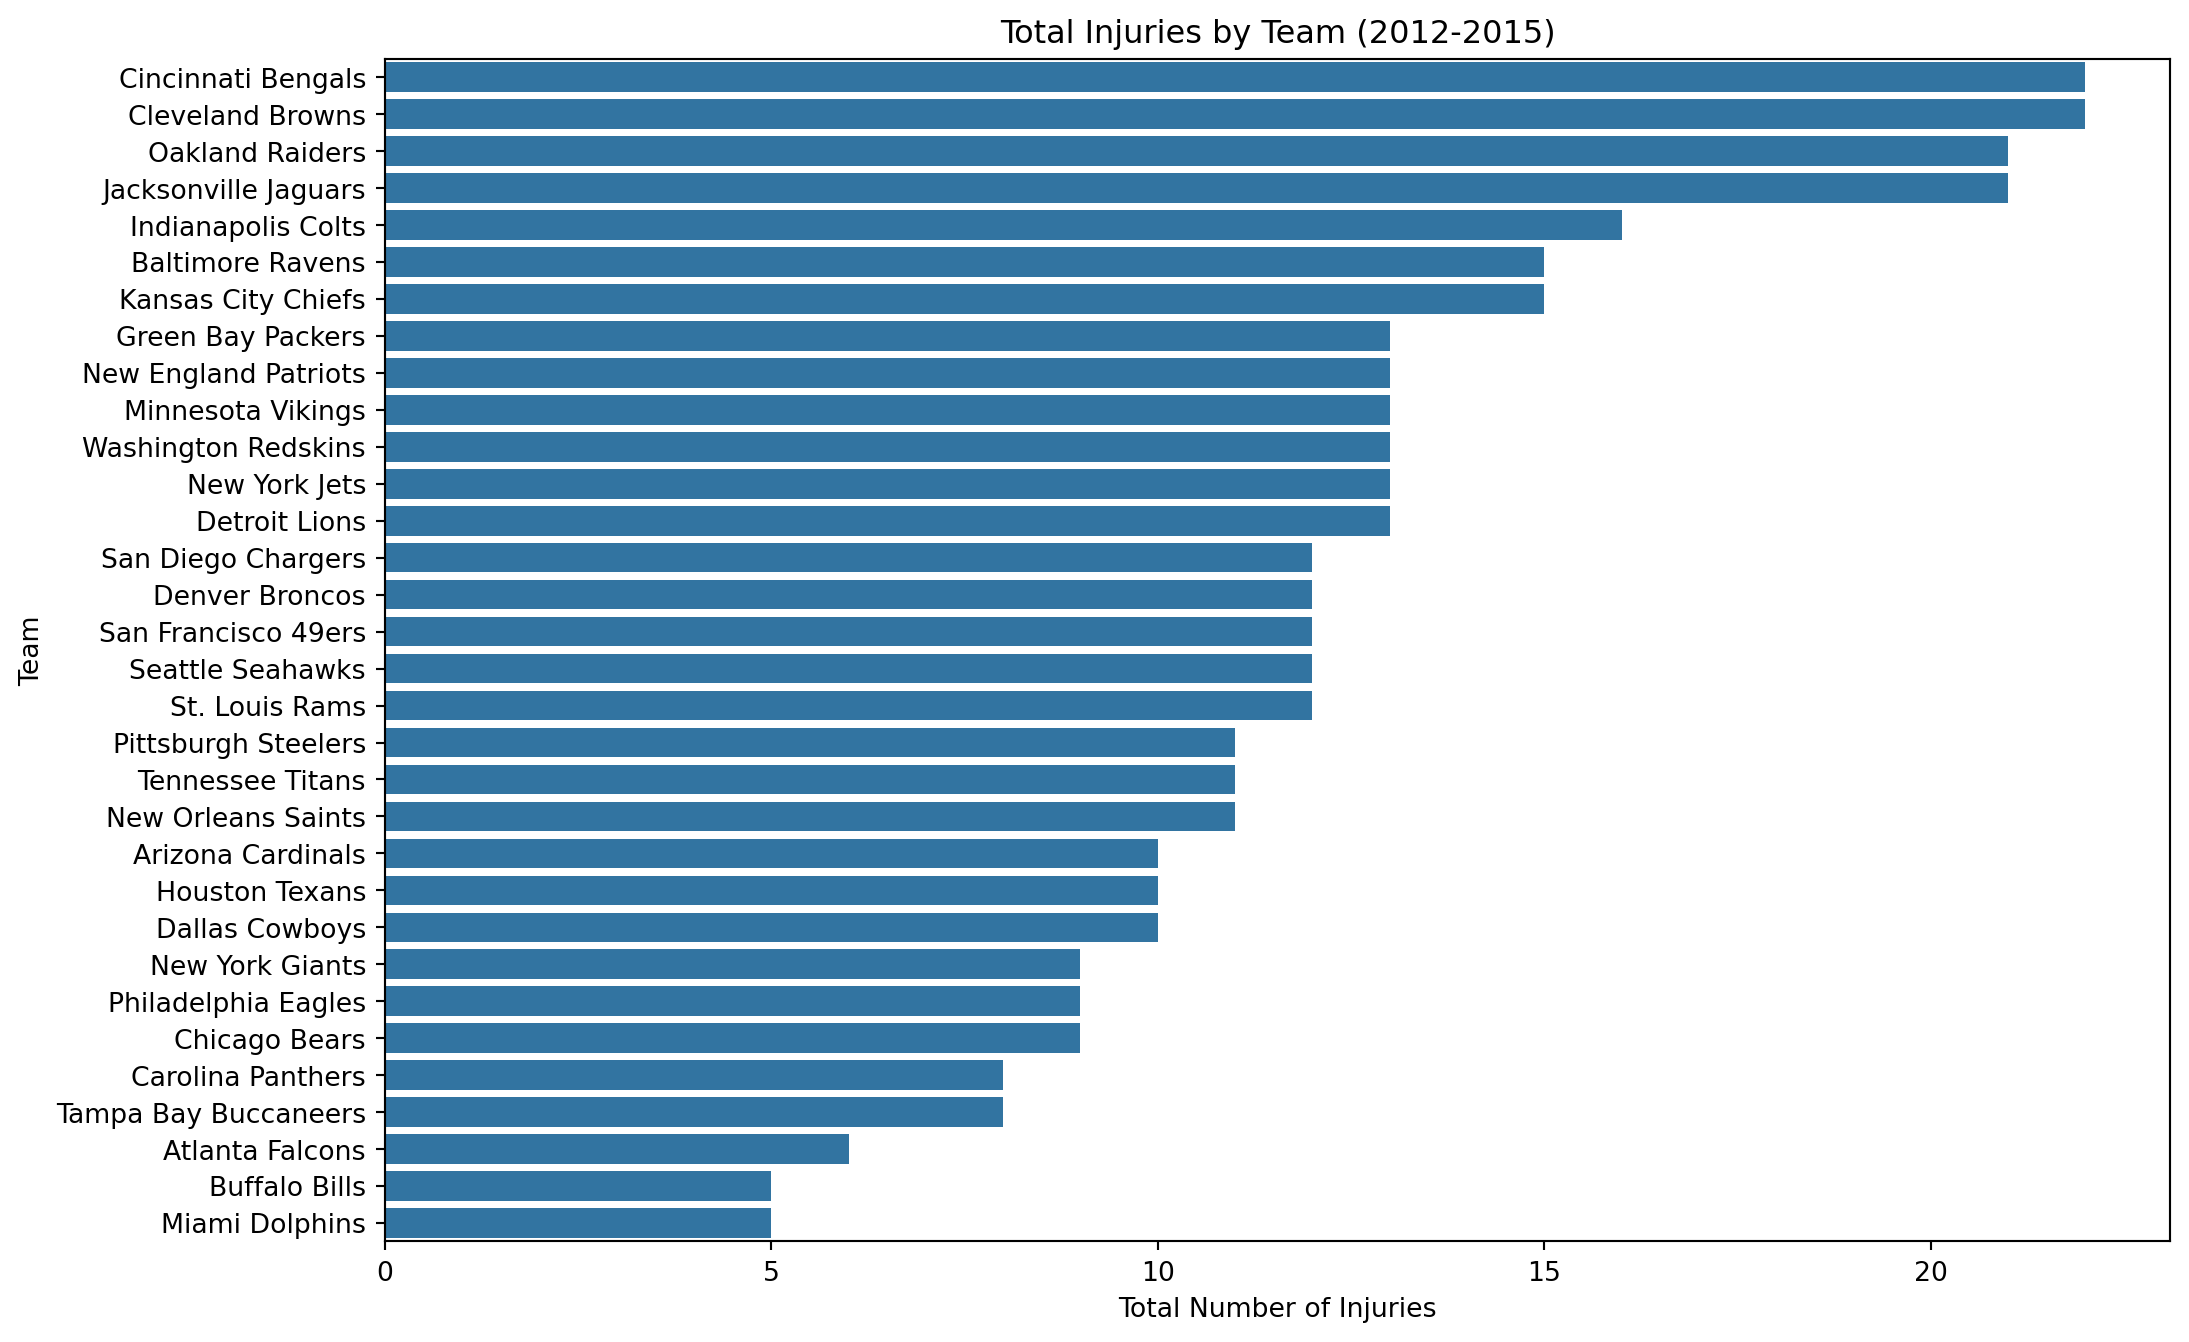
- Teams with the highest injury rates: Cincinnati Bengals and Cleveland Browns (22 injuries each)
- Teams with the lowest injury rates: Buffalo Bills and Miami Dolphins (5 injuries each)
2.4 Seasonal Patterns
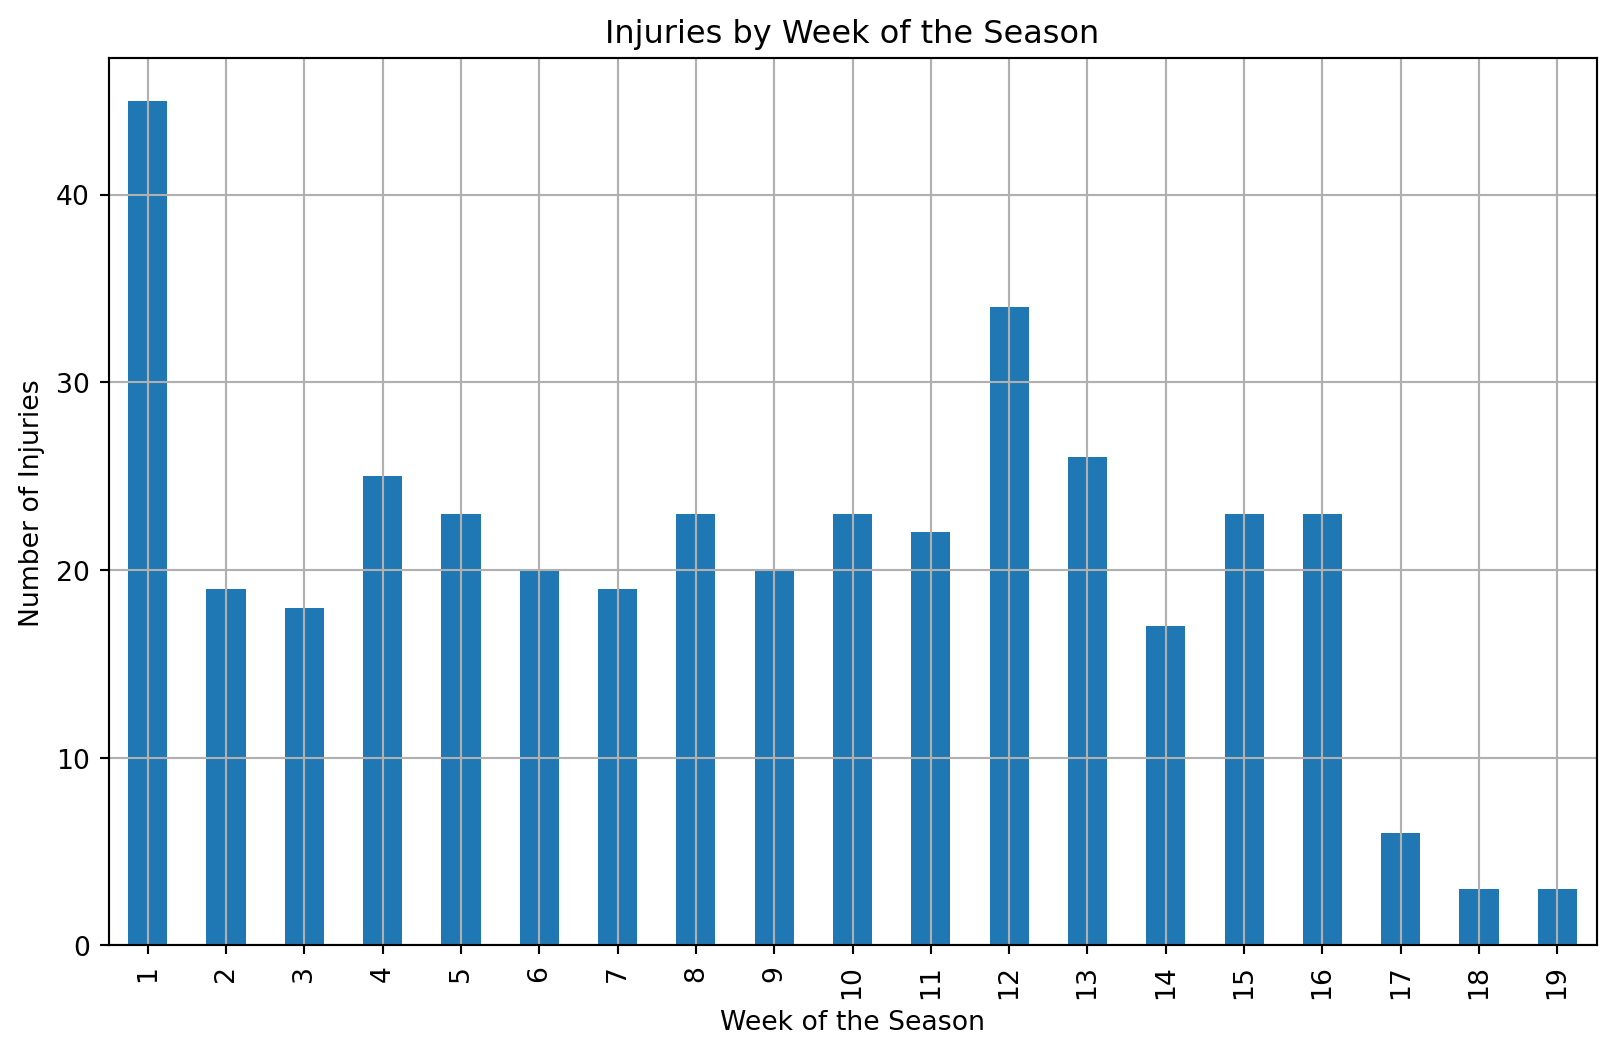
- The highest number of injuries occurred in Week 1 (45 injuries) and Week 12 (34 injuries).
- There’s a noticeable drop in injuries in the last few weeks of the season (Weeks 17-19).
3 Detailed Analysis
3.1 Concussion Injuries 2012-2014
- Injuries by Position:
Position
Comerback           64
Wide Receiver       56
Safety              51
Running Back        39
Tight End           39
Linebacker          37
Guard               26
Offensive Tackle    22
Defensive End       20
Quarterback         14
Defensive Tackle    13
Center               7
Full Back            3
Long Snapper         1
dtype: int64- Cornerbacks (64 injuries) and Wide Receivers (56 injuries) are the most frequently injured positions.
- Winning vs. Losing Teams:
- Winning teams: 182 injuries
- Losing teams: 210 injuries
- Injury Severity:
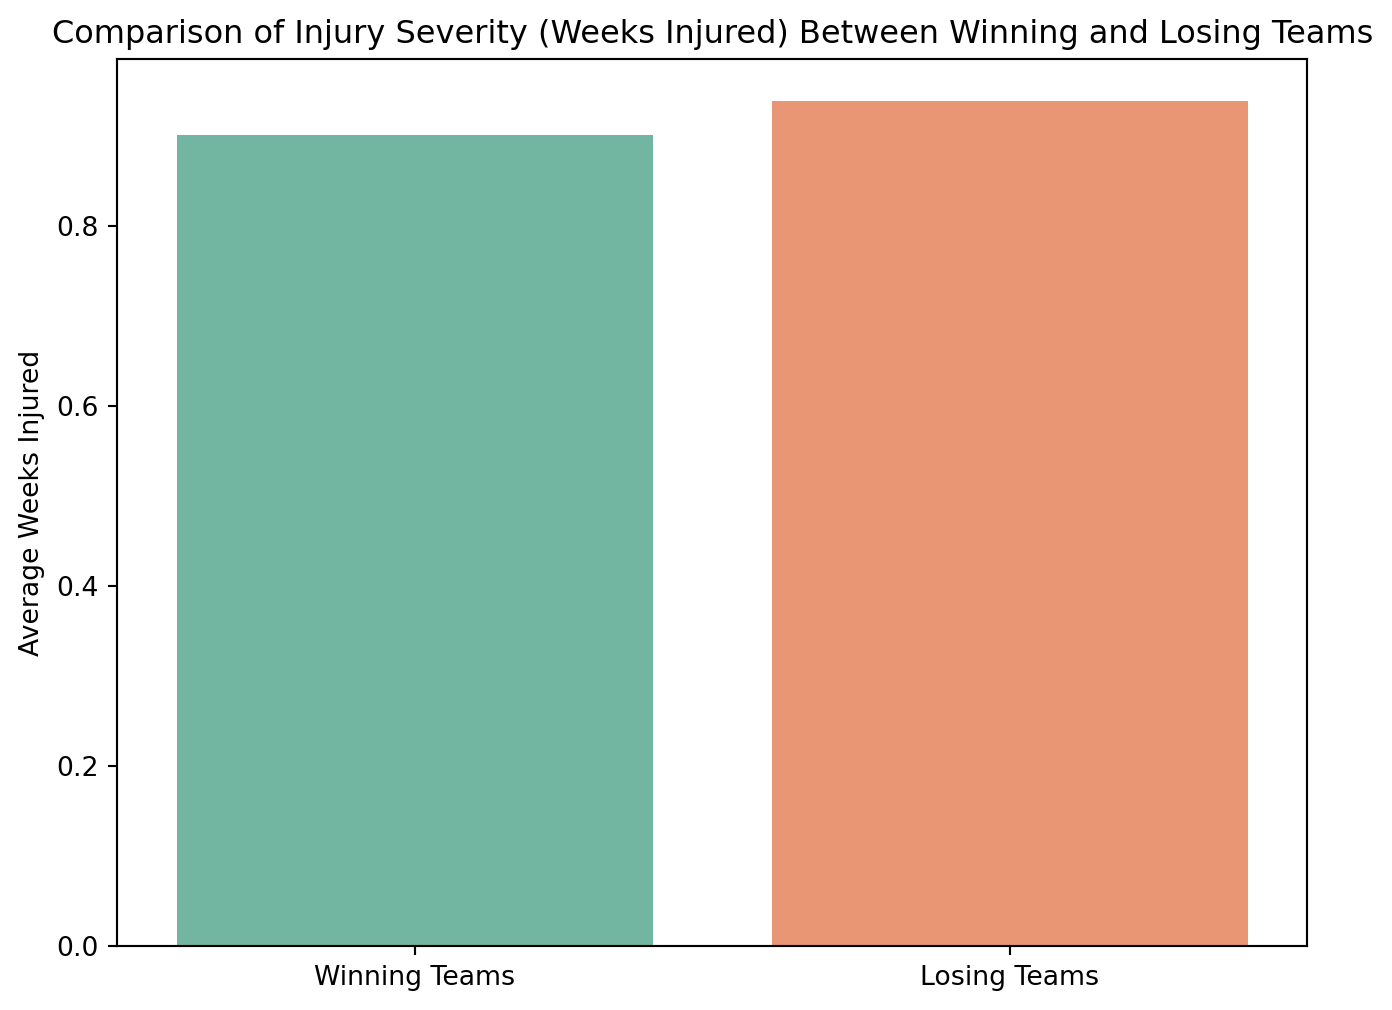
- Winning teams average 0.90 weeks of injury
- Losing teams average 0.94 weeks of injury
3.2 Head Injured Players
- Age and Injury Correlation:
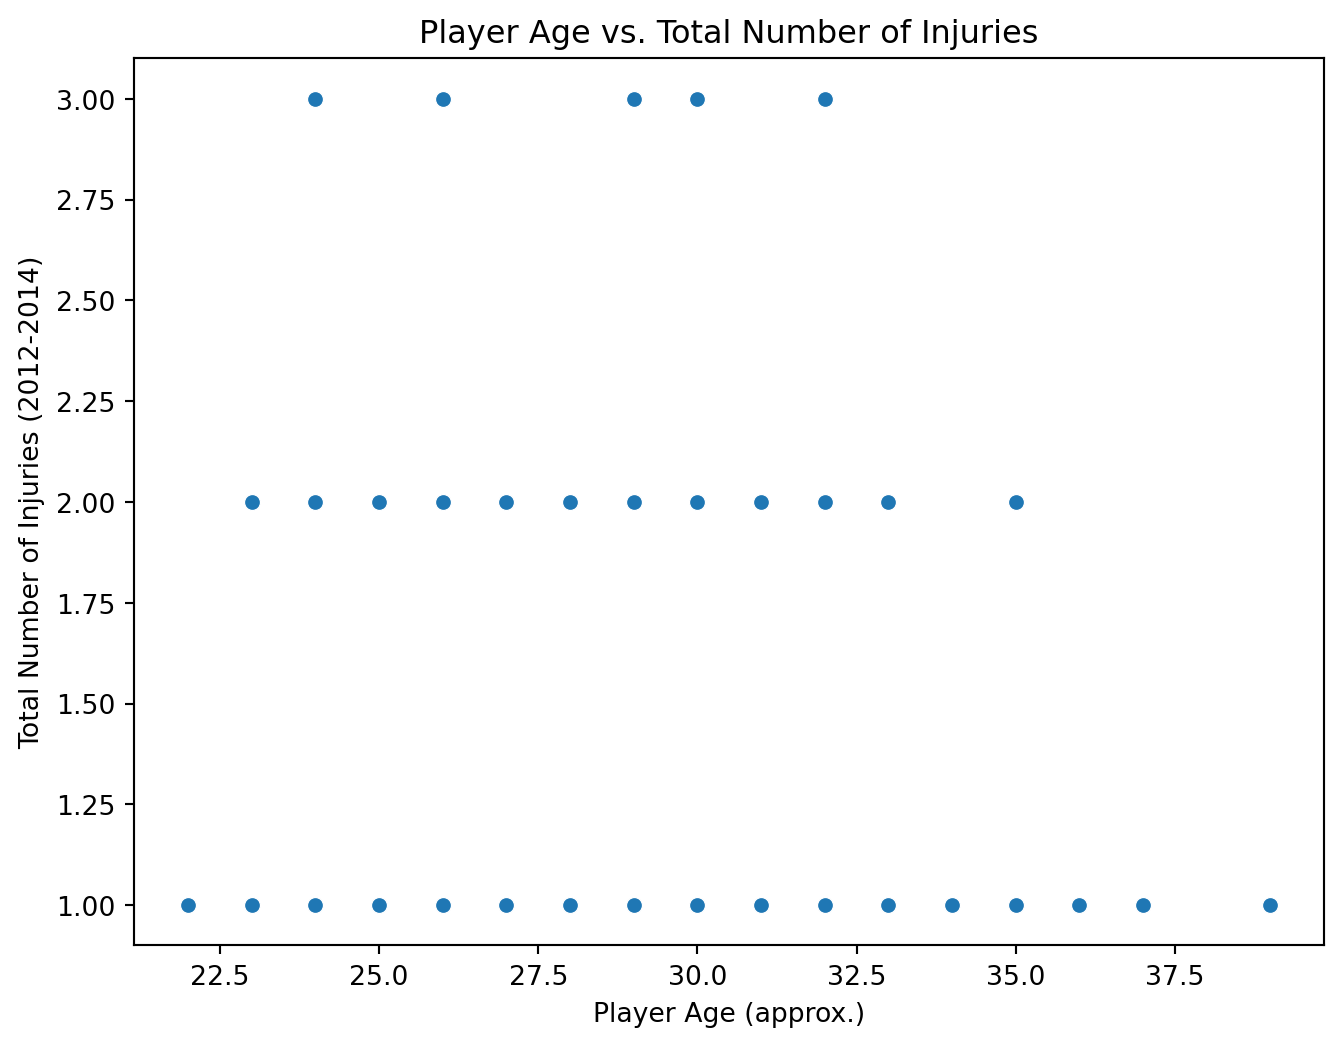
- The correlation between player age and total number of injuries is 0.05, indicating a very weak positive correlation.
3.3 Team-Level Analysis
- The state with the highest average number of injuries per team is Ohio, with an average of 22.00 injuries.
3.4 Injury Severity and Team Performance
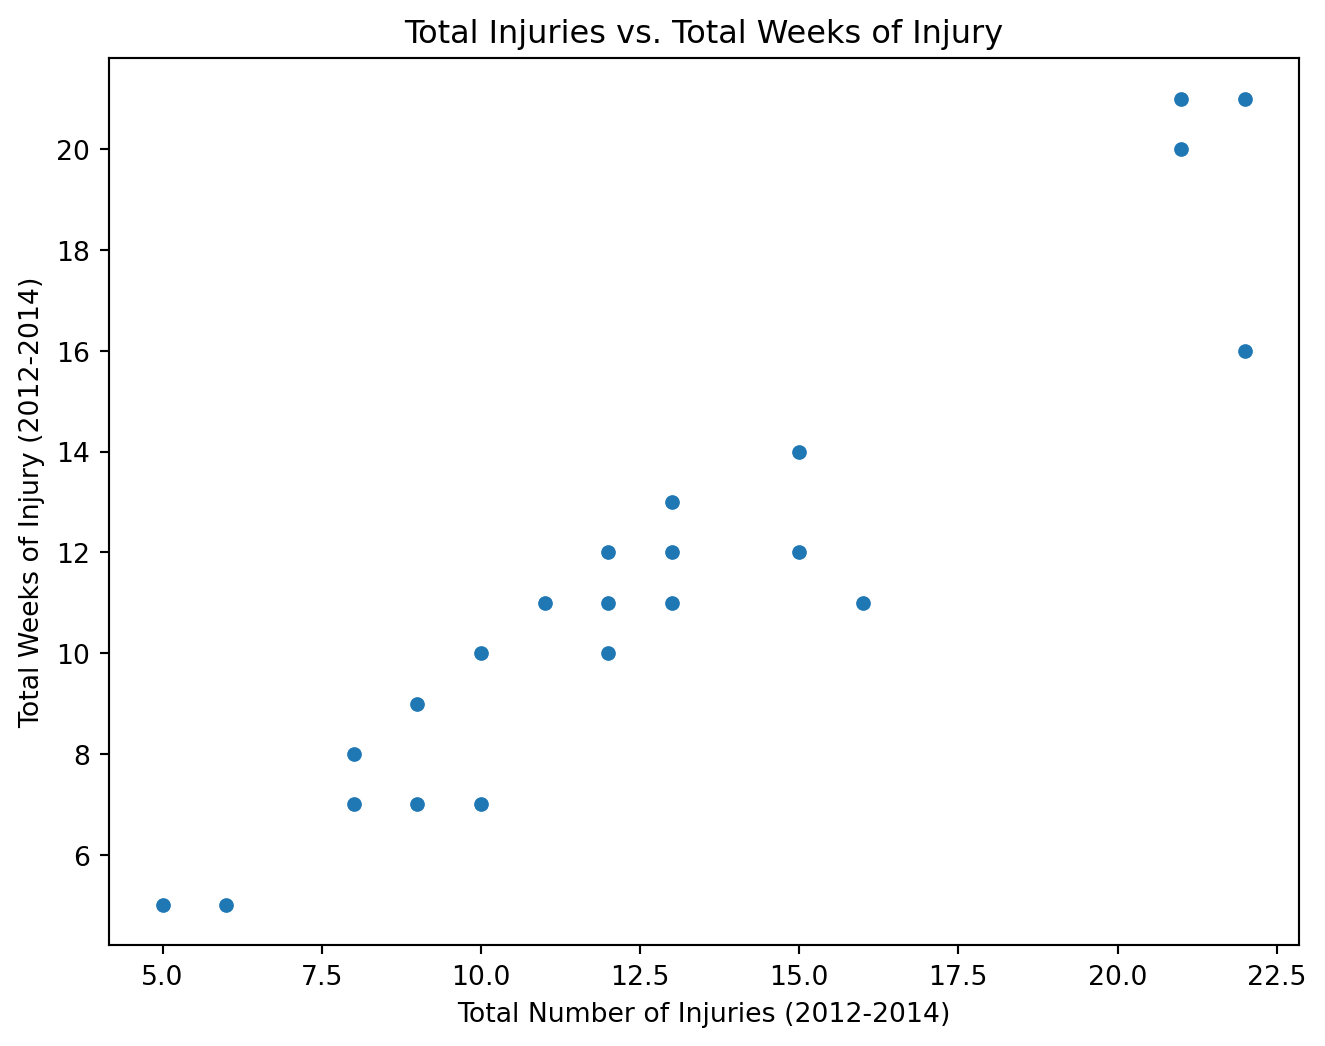
- The correlation between total injuries and total weeks of injury is 0.94, indicating a strong positive correlation.
- The Cleveland Browns missed the most games due to injuries, with 21 games missed.
4 Conclusions and Recommendations
- Injury Prevention: Focus on positions with high injury rates (Cornerbacks and Wide Receivers).
- Team Strategy: Investigate why losing teams have slightly higher injury rates and durations.
- Seasonal Planning: Implement strategies to reduce injuries in high-risk weeks (Week 1 and Week 12).
- Player Management: While age doesn’t strongly correlate with injury risk, individual player history should be considered.
- Geographic Considerations: Teams in states with higher injury rates (e.g., Ohio) might need to review their training and medical protocols.
5 Appendix: Methodology
This analysis used Python with pandas for data manipulation, matplotlib and seaborn for visualization, and plotly for interactive maps. Statistical measures included correlation analysis and descriptive statistics.